

Equities Research: A Cornerstone of Investment Decisions
Equities research is a fundamental pillar of the investment process. It involves analyzing companies listed on stock exchanges to assess their financial health, future prospects, and intrinsic value. Research analysts meticulously evaluate a range of factors, including financial statements, market trends, competitive landscape, and management quality. This analysis leads to recommendations and target price estimations which guide investment decisions.
Exploring Use Cases for Machine Learning in Equities Research
After exploring several use-cases of how ML can be applied to several key aspects of equities research, let’s review two use-cases for the purpose of this paper
- Target Price Estimation: Using historical data and various financial metrics, attempt to predict a company’s projected stock price with greater accuracy.
- Rating Analysis: Build a model that can predict the likelihood of a stock rating recommendation being accurate or not..
Navigating the landscape of ML algorithms to identify the suitable approach for a specific use can be challenging. This research aims to provide a preliminary exploration of potential ML solutions for both of these use cases. With the aim that the same approaches can be adopted in more large scale Equities Research ML usages.
This study adopts a “proof of concept” approach, prioritizing the exploration of various ML algorithms to gain insights into their applicability for our use cases. By implementing a selection of relevant algorithms and evaluating their performance on sample data, we aim to steer the direction for further, more in-depth research.
While this research does not claim to provide an exhaustive analysis or a definitive “best fit” solution, it leverages a focused investigation of several prominent ML algorithms. The results aim to inform future research efforts by highlighting promising avenues for in-depth exploration and model optimization.
Challenges and Limitations: The Volatile Nature of Markets
It’s crucial to acknowledge the inherent challenges of using ML in equities research. Financial markets are notoriously volatile, influenced by unpredictable events, investor sentiment, and macroeconomic factors. While ML models can process vast amounts of data, they cannot perfectly capture these complexities.
Furthermore, investor sentiment, a significant driver of market movements, is subjective and difficult to quantify. It’s essential to recognize that ML predictions for equities research should be viewed as valuable tools to assist and augment analysts tasks, not a guarantee of future performance. The ultimate aim of our research is to build an AI tool which can generate a full analyst model (all forecast data) as company reports are released and in situations where market sentiment changes, but this tool will ultimately be used to assists and be a time saver for the analysts, allowing them to focus more on their long form research rather than number crunching.
Python Libraries Used
- Scikit-learn: A Powerful Toolbox for Regression, Classification and Neural Networks
- Matplotlib: For Visualizing our data
Data Sourcing and Preparation: Building the Foundation
A critical feature of any machine learning project is the data used to train and evaluate the models. This research leveraged historical research and market data from approximately six thousand companies, spanning the period of 2019-2022.
Data Cleaning and Preprocessing: Ensuring Consistency
Before feeding the data into the algorithms, a meticulous data preparation process was undertaken. This involved several steps to ensure consistency and quality:
- Normalization: Data normalization ensures that all features have a similar scale, preventing features with larger ranges from dominating the analysis. This can be achieved through techniques like min-max scaling or z-score normalization. WE also converted all price data to the same currency (USD) for consistency.
- Missing Value Handling: Missing data points can negatively affect the performance of machine learning models. We addressed missing values using techniques like mean/median imputation (replacing missing values with the average/median of the feature) or deletion (removing rows or columns with a high degree of missing values).
- Feature Scaling: Feature scaling further refines the data by transforming each feature to a specific range (e.g., 0 to 1). This enhances the convergence of some machine learning algorithms, particularly those employing gradient descent for optimization.
- One Hot Encoding: To handle the categorical recommendation variable (Buy, Hold, Sell) in our regression model, we applied One-Hot Encoding. This approach creates binary features for each unique recommendation, enabling the model to learn the relationship between numerical features and different recommendation classes.
- Feature Selecting: To improve model performance and reduce training time, we explored feature selection techniques like bi-directional elimination. This method iteratively removes features that contribute the least to the model’s performance, potentially leading to a more concise and informative feature set.
Financial Data used on our training data:
Equities Research consists of a huge amount of features. Our final training set contained approximately 50 primary features, including % changes in values over time. The main features are outlined below
- Current Share Price: The stock’s current trading price.
- Market Cap: The total market value of a company’s outstanding shares.
- Rating: An analyst’s assessment of a company’s creditworthiness or financial strength. (This might be encoded using one-hot encoding if there are multiple rating categories).
- Target Price: The predicted future price of the stock at a specific time horizon (e.g., 12 months later).
- Financial Ratios:
- P/E Ratio (Price-to-Earnings): Ratio of share price to earnings per share.
- P/B Ratio (Price-to-Book): Ratio of share price to book value per share.
- Current Ratio: Ratio of current assets to current liabilities (might require transformation).
- EPS (Earnings Per Share): Company’s profit attributable to each share of common stock.
- DPS (Dividend Per Share): Amount of cash paid to shareholders per share.
- FCF (Free Cash Flow): Cash flow a company generates after accounting for cash outflows to support its ongoing operations and investments.
- Dividend Yield: Ratio of annual dividend payment per share to the current share price.
Use Case 1 Target Price Estimation
Objective: Using historical data and various financial metrics, attempt to predict a company’s projected stock price with greater accuracy.
Using Regression for this Use Case
Machine learning offers a multitude of techniques for tackling problems involving prediction. In this research, we focus on regression. Regression algorithms were trained to learn the relationship between a set of features (data points representing various aspects of a company in our case) and a continuous target variable (e.g., target price in our case). By analyzing historical data, the regression model establishes a correlation between these features and the target price. After trained, the model can then be used to predict target prices for new, unseen data points based on the learned relationship. In essence, regression allows us to leverage historical information to make informed predictions about future outcomes, such as estimating the target price for a company based on its financial health and market trends.
The following Regression algorithms were explored
- Linear Regression: Fits a straight line to the data, capturing the linear relationship between features and target variable.
- Support Vector Regression: Finds a hyperplane that best separates the data points, even for non-linear relationships.
- Decision Tree Regression: Splits the data based on decision rules, creating a tree-like structure for predictions.
- Random Forest Regression: Combines multiple decision trees to make robust predictions, handling non-linearity and feature interactions.
- Neural Networks: Learns complex relationships through interconnected layers of nodes, often achieving high accuracy but with limited interpretability.
Approach to Analyzing the Data
To analyze the effectiveness of the model in predicting target prices for equities research, we employed a combination of metrics that assess the model’s ability to accurately align with actual target prices. Here’s a breakdown of the key metrics used:
- R² Score: This measures how well our model explains the predicted target prices. Think of it like a score from 0 to 1, where 1 means the model perfectly explains all predictions, and 0 means it explains nothing.
- Mean Absolute Error (MAE): This shows the average difference between the target prices our model predicts and the actual target prices. The lower the MAE, the closer our predictions are to reality.
- Root Mean Squared Error (RMSE): This combines the size and direction of prediction errors, giving a sense of overall prediction accuracy. A lower RMSE indicates better performance.
By analyzing these metrics together, we gained a good understanding of the model’s performance in predicting target prices. A high R² score with low MAE suggests a robust model that can accurately estimate target prices, providing valuable insights for equities research analysts.
Code Approach:
Our code approach across the various regression algorithms generally consisted of
Data Wrangling: Missing numerical values were filled with a constant (scikit-learn’s SimpleImputer). Categorical data (assumed in the first column) is one-hot encoded (scikit-learn’s ColumnTransformer with OneHotEncoder).
Train-Test Split: Our code splits the preprocessed data into training and testing sets for evaluation (scikit-learn’s train_test_split).
Regression Model: Our code trains a regression model to predict target prices (scikit-learn’s LinearRegression, PolynomialFeatures, DecisionTreeRegressor, RandomForestRegressor).
Neural Network Approach: Our approach with Neural Networks involved using TensorFlow to construct and train the model. We configured a neural network with three hidden layers and one output layer, which proved to be the most effective architecture after several iterations. The network’s first hidden layer consists of 128 neurons, followed by subsequent layers with 64 and 32 neurons, all employing ReLU activation functions. The output layer has a single neuron, suitable for regression, reflecting the target price prediction.
The model was compiled with the Adam optimizer and mean squared error loss function, aligning with our objective to minimize prediction errors. We trained the model on our preprocessed dataset for 100 epochs with a batch size of 32 and incorporated a validation split of 20% to monitor and prevent overfitting.
Visualization: Our code visualizes predicted vs. actual target prices using Matplotlib for review purposes.
Model Evaluations and Our Results:
Though various feature set adjustments etc. our analysis yielded the following results
| Algorithm (Regression) | R² score | MAR | RMSE |
| Linear Regression | 0.8 | 0.18 | 0.22 |
| Support Vector Regression | 0.67 | 0.27 | 0.32 |
| Decision Tree Regression | 0.85 | 0.14 | 0.19 |
| Random Forest Regression | 0.86 | 0.09 | 0.13 |
| Neural Networks | 0.85 | 0.1 | 0.14 |
Summary of Regression Model Performance for Target Price Estimation
Based on the adjusted R² score, Mean Absolute Error (MAE), and Root Mean Squared Error (RMSE), here’s our analysis of each regression algorithm’s performance in predicting target prices:
Strong Performers:
- Random Forest Regression:
- R² score: 0.86 (Strong correlation between predicted and actual prices)
- MAE: 0.09 (Highly accurate predictions)
- RMSE: 0.13 (Relatively low overall prediction errors)
- Random Forest emerges as the top performer, demonstrating a strong ability to capture the underlying relationships between features and target prices, leading to highly accurate predictions with low overall errors.
- Neural Networks:
- R² score: 0.85 (High correlation)
- MAE: 0.10 (Moderate prediction errors)
- RMSE: 0.14 (Moderate overall prediction errors)
- Neural Networks also exhibit strong performance, achieving a high correlation with actual prices and relatively accurate predictions.
Moderate Performer:
- Decision Tree Regression:
- R² score: 0.85 (Good fit to the data)
- MAE: 0.14 (Relatively higher prediction errors compared to Random Forest)
- RMSE: 0.19 (Moderate overall prediction errors)
- Decision Tree Regression shows good performance with a decent fit to the data. However, its prediction accuracy and overall error are slightly lower than Random Forest and Neural Networks.
Weaker Performers:
- R² score: 0.80 (Good fit to the data, but lower than Random Forest and Decision Tree)
- MAE: 0.18 (Lower accuracy than Random Forest)
- RMSE: 0.22 (Higher overall prediction errors)
- While Linear Regression demonstrates a good fit to the data, its prediction accuracy and overall error are lower compared to the other strong performers.
- Support Vector Regression (SVR):
- R² score: 0.69 (Weak fit to the data)
- MAE: 0.25 (Significant prediction errors)
- RMSE: 0.32 (Significant overall prediction errors)
- SVR exhibits the weakest performance among the explored algorithms, with a significantly lower R² score and higher prediction errors.
Overall:
Random Forest Regression stands out as the most effective algorithm for predicting target prices based on the metrics analyzed. Neural Networks also demonstrate strong performance. While Decision Tree Regression shows promise, its accuracy and overall error are slightly lower. Linear Regression and SVR exhibit weaker performance in this context.
It’s crucial to remember that these metrics provide a snapshot of the models’ performance based on the specific data and chosen evaluation measures. A more comprehensive analysis with additional metrics and potentially different datasets might reveal further insights and potentially shift the ranking of the algorithms.
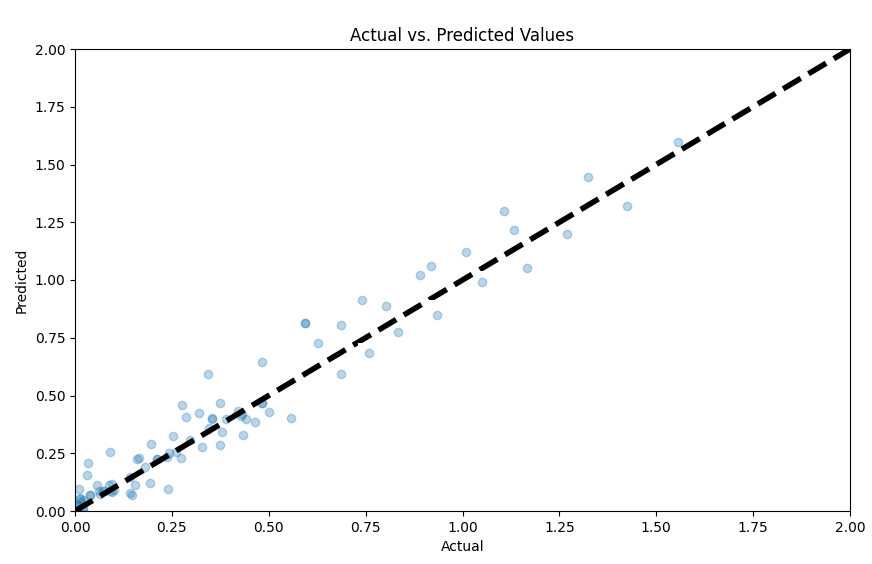
Figure 1: Plot of predictions vs actuals for Random Forest Regression
Use Case 2: Stock Rating Accuracy Prediction
Objective: Financial analysts often rely on stock rating recommendations from various agencies. However, the accuracy of these ratings can vary. Hence, this research aims to develop a machine learning model that can forecast the possibility of a stock rating recommendation being accurate or inaccurate based on available financial and market data.
Using Classification for this Use Case:
While Use Case 1 focused on predicting continuous target variables like stock prices using regression algorithms, Use Case 2 deals with predicting a binary outcome: whether a stock rating is accurate or not. Therefore, classification algorithms are more suitable for this task. Similar to regression, classification algorithms learn the relationships between features and a target variable, but in this case, the target variable is categorical (accurate/inaccurate rating). By analyzing historical data, the model learns to identify patterns and relationships that distinguish accurate from inaccurate ratings. After that, the model can be used to predict the accuracy of new, unseen stock ratings based on the learned patterns.
Classification Algorithms Explored:
This research explores the following classification algorithms from Scikit-learn:
- Logistic Regression: A popular and versatile algorithm for binary classification problems.
- Decision Tree Classifier: Creates a tree-like structure to classify data points based on a series of decision rules.
- Random Forest Classifier: An ensemble method that combines multiple decision trees, often leading to more robust predictions.
- XGBoost: A powerful and scalable gradient boosting algorithm known for its high performance in various classification tasks.
- K-Nearest Neighbors (KNN): Classifies data points based on their similarity to a set of predefined neighboring data points.
- Neural Networks: A powerful and flexible modeling technique capable of learning complex relationships between features and target variables.
Financial Data used on our training data:
The same features from Use Case 1 were incorporated for this use case also. However we also added a binary 1 or 0 to indicate whether the ‘Buy’, ‘Sell’ or ‘Hold’ prediction was accurate. Obviously there is some subjective decision making here. For ‘Buy’ and ‘Sell’ we took the simplistic approach of checking if the stock price went up or down by certain percentage thresholds 12 months after the prediction. Also for ‘Hold’, which can be more vague, we considered elements like share price 12 months later, market cap and volatility to determine different percentage thresholds, such that if the share price change % stayed within such thresholds the ‘Hold’ was considered accurate.
Approach to Analyzing the Data:
To evaluate the effectiveness of our classification model in predicting the accuracy of stock ratings, we will utilize appropriate metrics that assess the model’s ability to correctly classify accurate and inaccurate ratings. Here are some key metrics we will consider:
- Accuracy: Measures the overall percentage of correct predictions made by the model.
- Precision: Measures the proportion of positive predictions that are actually accurate.
- Recall: Measures the proportion of actual accurate ratings that are correctly identified by the model.
- F1-Score: A harmonic mean of precision and recall, providing a balanced view of both metrics.
- Confusion Matrix: A visualization tool that shows how many data points were correctly classified and how many were misclassified (e.g., accurate ratings predicted as inaccurate).
Analyzing these metrics together will provide a comprehensive understanding of the model’s performance in predicting stock rating accuracy.
Code Approach:
Our code approach aligned with our code approach for our Target Price prediction use case, with the following adaptations.
Key Adaptations:
- Classification Algorithms: Replaced references to regression models with classification algorithms (Logistic Regression, Decision Tree Classifier, Random Forest Classifier, and XGBoost).
- Target Variable: Implied that the target variable now represents the classification labels (accurate/inaccurate rating) instead of continuous target prices.
- Neural Networks: Again we ended up with three hidden layers and one output layer. The network’s first hidden layer consists of 80 neurons, followed by subsequent layers with 40 and 20 neurons, all employing ReLU activation functions. The output layer has a single neuron
Model Evaluations and Our Results:
Though various feature set adjustments etc. our analysis yielded the following results
| Algorithm (Classification) | Precision | Recall | F1 Score | ROC AUC | Accuracy |
| Logistic Regression | 0.59 | 0.43 | 0.5 | 0.59 | 0.6 |
| Neural Networks | 0.7 | 0.69 | 0.69 | 0.72 | 0.72 |
| KNN | 0.64 | 0.58 | 0.61 | 0.65 | 0.66 |
| XGBoost | 0.78 | 0.72 | 0.75 | 0.77 | 0.78 |
| Decision Tree | 0.73 | 0.8 | 0.76 | 0.77 | 0.77 |
| Random Forest | 0.76 | 0.66 | 0.71 | 0.74 | 0.75 |
Summary of Classification Model Performance for Stock Rating Accuracy Prediction
Based on the provided precision, recall, F1 score, ROC AUC score, and accuracy metrics, we analyze the performance of each classification algorithm in predicting the accuracy of stock ratings:
Strong Performers:
- Precision: 0.78 (High ability to identify true positives)
- Recall: 0.72 (Good ability to identify true negatives)
- F1 Score: 0.75 (Balanced performance between precision and recall)
- ROC AUC Score: 0.77 (High ability to distinguish accurate from inaccurate ratings)
- Accuracy: 0.78 (Highest overall accuracy) XGBoost emerges as the strongest performer, demonstrating a well-balanced performance across all metrics. Its high precision, recall, and AUC score indicate a strong ability to accurately classify both accurate and inaccurate ratings.
Moderate Performers:
- Precision: 0.73 (Good ability to identify true positives)
- Recall: 0.80 (Very high ability to identify true negatives)
- F1 Score: 0.76 (Balanced performance)
- ROC AUC Score: 0.77 (High ability to distinguish classes)
- Accuracy: 0.77 (Good overall accuracy) Decision Tree exhibits good performance with a strong focus on identifying true negatives (accurate ratings). While its precision is slightly lower than XGBoost, it achieves a high F1 score and AUC score, indicating a well-rounded performance.
- Precision: 0.76 (Good ability to identify true positives)
- Recall: 0.66 (Moderate ability to identify true negatives)
- F1 Score: 0.71 (Balanced performance)
- ROC AUC Score: 0.74 (Good ability to distinguish classes)
- Accuracy: 0.75 (Good overall accuracy) Random Forest shows a balanced performance across metrics, with slightly lower recall compared to Decision Tree. However, its overall accuracy and F1 score remain strong, suggesting a reliable classification ability.
Other Performers:
- Precision: 0.70 (Good ability to identify true positives)
- Recall: 0.69 (Moderate ability to identify true negatives)
- F1 Score: 0.69 (Balanced performance)
- ROC AUC Score: 0.72 (Good ability to distinguish classes)
- Accuracy: 0.72 (Good overall accuracy) Neural Networks exhibit good performance with a balanced focus on precision and recall. While its scores are slightly lower than the top performers, it remains a strong contender due to its ability to learn complex relationships within the data.
- KNN:
- Precision: 0.64 (Moderate ability to identify true positives)
- Recall: 0.58 (Moderate ability to identify true negatives)
- F1 Score: 0.61 (Balanced performance)
- ROC AUC Score: 0.65 (Moderate ability to distinguish classes)
- Accuracy: 0.66 (Moderate overall accuracy) KNN demonstrates a moderate performance with balanced precision and recall. Its lower scores compared to other algorithms suggest that the specific data distribution or “k” parameter might require further optimization.
Overall:
XGBoost stands out as the most effective algorithm for predicting stock rating accuracy based on the analyzed metrics. Decision Tree and Random Forest also show strong performance, while Neural Networks and KNN exhibit moderate capabilities. The choice of the best algorithm ultimately depends on the specific targets and priorities of the analysis, such as the relative importance of precision, recall, or overall accuracy.
It’s important to note that these results are based on the specific dataset and chosen evaluation metrics. Further analysis with additional metrics or different datasets might provide further insights and potentially alter the ranking of the algorithms.
What’s the Point of All This?
The exploration of these use cases represents a significant step towards integrating AI into the daily workflow of research analysts in the field of equities research. By leveraging machine learning algorithms to tackle tasks such as target price estimation and rating accuracy prediction, we are paving the way for a more efficient, data-driven, and insightful research process.
Target Price Estimation: Accurate target price predictions are crucial for investment decisions and portfolio management. The ability to leverage historical data and forecast variables to estimate target prices using advanced algorithms like Random Forests and Neural Networks can significantly enhance the precision and reliability of these estimates. This, in turn, can lead to more informed investment strategies and better-informed clients.
Rating Accuracy Prediction: Predicting the likelihood of a stock rating recommendation being accurate or not can be a game-changer for research analysts. By leveraging classification algorithms like XGBoost and Decision Trees, analysts can gain valuable insights into the factors that influence rating accuracy. This knowledge can be used to refine their research methodologies, improve the quality of their recommendations, and ultimately enhance their credibility with clients.
Beyond these specific use cases, the integration of AI into equities research modeling opens up a world of possibilities for analysts:
- Automated Model Building: AI systems could be trained to automatically generate financial models and forecasts based on incoming data, such as earnings reports or market trends. This would significantly reduce the time and effort required for manual model creation, freeing up analysts to focus on higher-level analysis and strategic decision-making.
- Continuous Model Refinement: As new data becomes available, AI algorithms can continuously update and refine existing models, ensuring that they remain relevant and accurate in the ever-changing financial landscape.
- Scenario Analysis: AI-powered models could be used to simulate various scenarios and stress-test investment strategies, providing analysts with valuable insights into potential risks and opportunities.
- Anomaly Detection: By leveraging machine learning algorithms, analysts could identify anomalies or patterns in financial data that may be indicative of potential investment opportunities or risks.
- Natural Language Processing (NLP): NLP techniques can be employed to analyze vast amounts of financial news, reports, and social media data, extracting valuable insights and sentiment analysis that can inform investment decisions.
The possibilities are vast, and the potential for AI to transform the way research analysts operate is significant. By embracing these technologies, analysts can enhance their analytical capabilities, streamline their workflows, and ultimately deliver higher accuracy and valuable insights to their clients.

